Has there been an update on the Portal Menu - Security Sub-Systems?
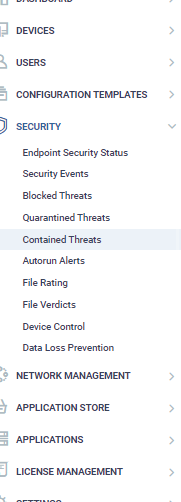
I noticed that ‘Security Sub-Systems’ has been renamed to ‘Security’ and some subitems are added:
It looks like some logs are merged into a submenu.
Hopefully this is the beginning of a better and more intuitive way to find threats.
Am I missing some more improvements on this update?
Thanks.
Yes, in the post it was stated as: “The security Sub-System section under the ITarian Platform has been entirely renamed with a more comprehensive menu structure.”
But I can’t t find any info if there are improvements or changes on the contents per submenu or log.
The Security Sub-System section under the platform has been entirely renamed with a more comprehensive menu structure.
Here are the changes:
The old "Device List" tab of Antivirus has been renamed as "Endpoint Security Status" and located as a separate page under the "Security" menu.
The old "Security Dashboards" has been renamed as "Security Events". "Event View, File View, and Device View" tabs remained under this section, and "Android Threat History" has been added as a separate tab under the "Security Events" section.
The old "Current Malware List" tab of Antivirus has been renamed as "Blocked Threats" and located as a separate page under the "Security" menu.
The old "Quarantined Files" tab of Antivirus has been renamed as "Quarantined Threats" and located as a separate page under the "Security" menu.
The old "Containment" has been renamed as "Contained Threats".
The old "Autoruns Items" tab of Antivirus has been renamed as "Autorun Alerts" and located as a separate page under the "Security" menu.
The old "Application Control" has been renamed as "File Rating" and now this section contains 3 tabs:
1- File Rating: It shows the list on the old "Application Control".
2- Detected Scripts: It shows detected embedded codes.
3- Obsolete Files: Old "Obsolete Files" tab of Antivirus has been added as a tab under "File Rating".
The old "Valkyrie" has been renamed as "File Verdicts".
This is a separate feature request and it is on our mid-term roadmap. We’ll share it within the next release candidate posts when it is ready to be released.
It’s a pity that the logs are still not reliable:
I got a complaint about a user that his application was contained.
I looked in the ‘Contained Threats’ to look for the threat but couldn’t find the device.
In this log I only find 2 threats for today:
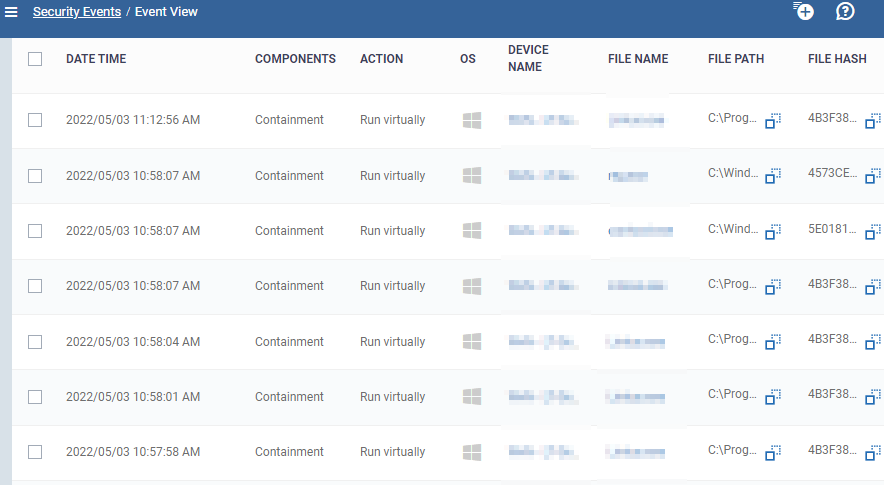
When digging in the ‘Security Events’, I find 99!!! containments only for today:
Still it’s very uneasy to find what you’re looking for.
Shouldn’t the containment entries also show up under the submenu ‘Contained Threats’?
Firstly, I couldn’t see your first attachment. But let me explain the case as I understand:
On the “Event View” of Security Events with “Containment” component filter, you can see all containment event records. It means there can be more than one record in this list for the same file.
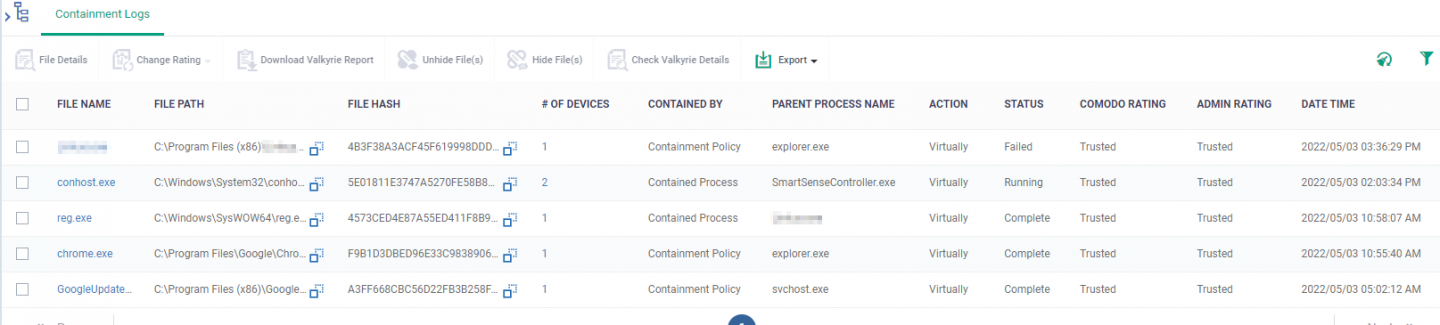
On the “Contained Threats”, this list shows containment logs with “Containment Policy” as “Contained by” filter by default. This list is file-based, so there is one record for the same file.
For the alliance of these two lists, could you please check on your end by filtering “Contained by” as “All” filter on “Contained Threats” and at the same time check the “File View” tab of “Security Events”?
Thanks for the explanation.
I think the upload of the image went wrong and cache is messed up because I can see both images on my machine but not on another. Sorry.
As I was replying to your question, I retyped my whole response because it’s getting more confusing for me.
I understand what you say. Clear.
Point is that a client called me about a newly implemented program that was contained.
They installed it a few days back when he called me on may 3th.
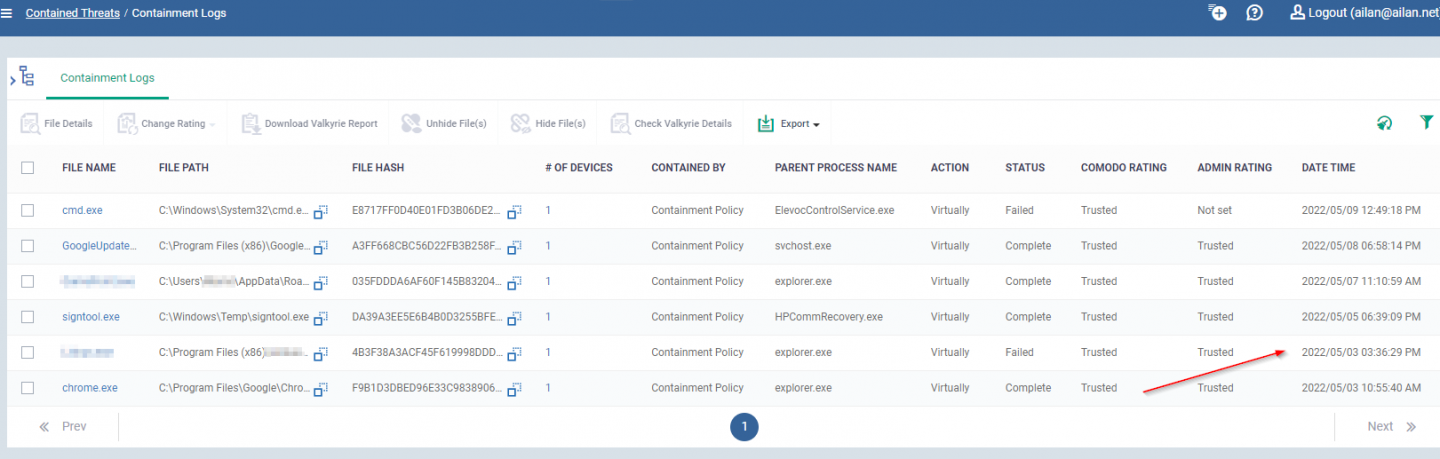
If I look at the ‘Containment’ entries for that day in the Contained threats, I see only 5 entries. (just like you requested. Filtered by date and selected ‘All’ at ‘Contained by’:
These are entries I can relate to max 3 different devices:
That is the first thing I notice:
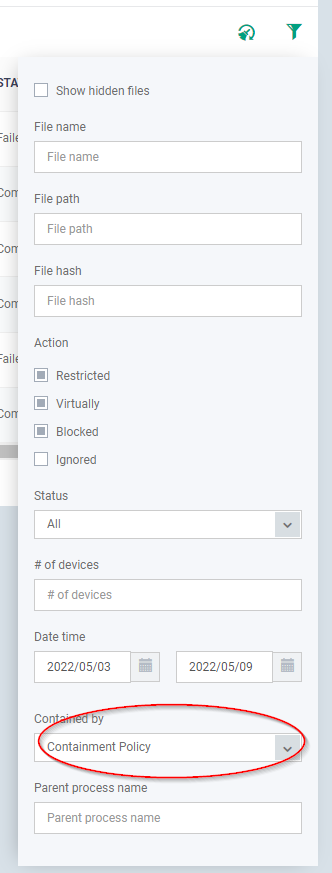
By Default, when selecting ‘Contained threats’, the report shows only the entries contained by Policy like you mentioned:
Why not all the contained entries? Now you only see a subset of all the entries if you don’t know there’s a filter.
But the second is that the affected entry wasn’t listed that moment the user called. I couldn’t find the entry regarding the device.
Now, 6 days later, when I check the logs again, I do see the entry. It appeared nearly 5 hours later that day after posting this post and checking the logs.
It takes sometime too much time between detection and logging before you can take actions:
This is just an example why I asked for email notifications with direct action buttons so you can react faster and don’t have to search through all the logs with all the delays.
We’ve taken your request into our plan about the functionality of the “Contained Threats” page to provide all containment logs. We also aim to improve our email template in our Q2 release.
For your logging issue, the portal adjusts the time with respect to the portal timezone. So, this issue may happen if the timezone is not correctly set on the endpoint. Team will create a support ticket to check this and inform you.
Thanks for replying.
No, It’s not the adjustments regarding the timezone or the different in timestamps.
It was about the delay before the entry appeared in the log. I did check several times at that day and couldn’t find the entry.
Now I see it did take nearly 5 hours before appearing.
So no support ticket has to be created. I just wanted to point out how it’s working in real life and that there’s room for some minor improvements that can solve these issues.
But out of the box, the default settings should be sufficient so that you can search, find and act on a threat within minutes.
You don’t want an outbreak because the entry shows up a few hours later after an incident.