I’ve had a few alerts set up for several months and might have gotten one alert every few weeks, suddenly since last night, I’m being BOMBARDED with them. I’m now getting them from PCs that aren’t even on - including high CPU alerts, again, from machines that aren’t even turned on.
ITSM new default profiles went live yesterday and were applied to all devices under ITSM. Go to ITSM then Configuration Templates from the menu and adjust the default profiles monitoring options.
Best thing to do is to clone the default one then adjust and turn it to your default device profile.
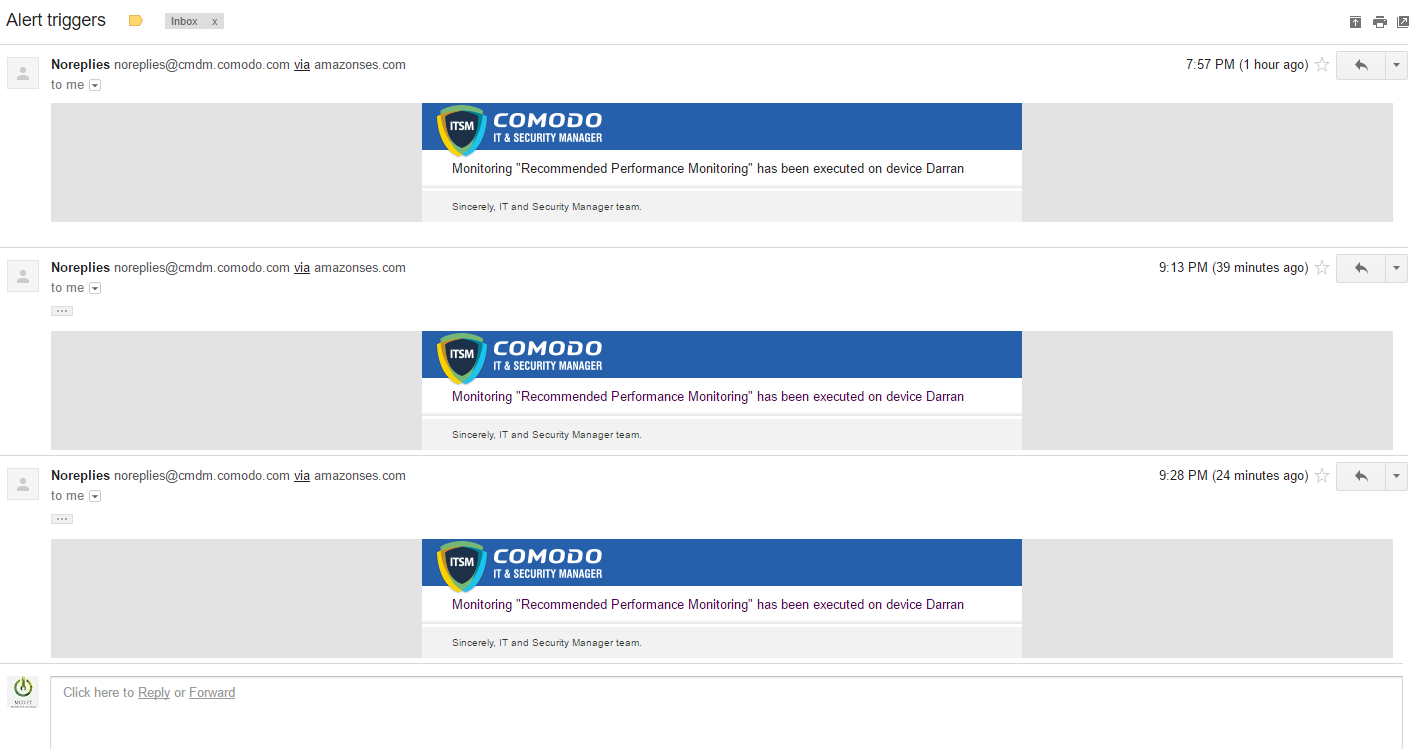
In my case I have disabled the monitoring through the RMM Console temporarily for all computers, using only the dashboard one. I seem to receive a number of duplicate emails saying:
Monitoring “Recommended Performance Monitoring” has been executed on device
Two machines last week ran very, very slowly one morning and I have a hunch it may have been because of this, as I was also sent a number of emails the same around that time.
Please try to go at ITSM > Configuration Templates > Alerts and create an alert that suits your requirements.
If you are to go to the specific profile that is governing the devices, edit it, you will find a tab (module) that contains the monitoring scheme.
If you choose to edit what is probably the default monitoring at the general tab at the bottom you have Use Alert Settings; here please apply the previously created alert.
At this point without any other information we are assuming that there are 2 monitoring schemes applied to the same device or device group.
Please let us know if this helped and if you encounter any issues.
It’s a little confusing to get around the menu. I’ve gone to - Profiles > Recommended Windows Profile for ITSM 5.4 > Monitoring > Recommended Performance Monitoring but I haven’t seen anything editable.
I think I would prefer to get rid of the monitoring through ITSM and use it through the RMM Console instead (that I have disabled) since it has more features and is a bit easier to get my head around. Is this recommendable or is the RMM Console going to be outdated some time soon?
The default profiles can’t be edited. It is recommended to clone a recommended profile, adjust the settings according to your needs and apply it on the device.
Regarding the second question, please note that we are moving towards migrating/integrating everything in ITSM, the platform is continuously updated and improved.
I see what you mean. I’m afraid I’ll need to give it a by-ball and use the RMM Console in the mean time. A little tongue in cheek, but it certainly isn’t easy to navigate when a member of staff gets confused!
RMM console monitoring is off. Changes haven’t been made to the console yet and I haven’t played around with anything related to it. I’ve ran a little bit of a test this evening by opening a clatter of tabs in Chrome and leaving the computer on while running errands. It seems to be that when an alert for anything (in this case ram) is triggered this email is sent to me as well, separately. Three new tickets were created (the way this does this isn’t ideal to be fair, though I know there is a setting that can be changed) and three “Monitoring “Recommended Performance Monitoring” has been executed on device…” were sent in separate emails.
I took the email to mean that the monitoring has just been enabled on the computer. Since it surely isn’t intended to notify me that I am being notified, is it a “monitoring enabled” email with a bug causing it to be sent like this or is it the case that there is some default setting that causes alerts to be sent to admins twice - or something along those lines?
It is very unclear, though I’m not saying this only out of complaint, as I know that Comodo is a work in progress and I’m glad to have it so far, but only that it might be beneficial to know how it appears to the user.
All the notifications sent out by ITSM when a monitoring profile is broken can be controlled by editing the Alert that is being used by that profile. If you go to Configuration Templates > Alerts and you see only one alert, then probably it is the default alert (it can’t be edited), so again you will have to clone it, edit the new alert, then apply it in the original profile (Configuration Templates > Profiles), for example:
Multiple emails would be triggered due to multiple breach on threshold. Every time conditions turns back to normal, monitors reset and service desk ticket closed automatically on default configuration. Next time same threshold breached, same alert would be triggered.
I see what you are saying there but maybe I didn’t make myself clear. What is this email exactly and if I was to use monitoring through the portal instead of through the RMM Console, what setting in “alerts” would turn it off? Since I wrote my last post I received 3 more of the same “Recommended Performance Monitoring has been executed on device” emails. One more about my own computer (making 4 in total since last night) and two others from two different computers. Of these two other computers, I should add, no new ticket alerts came with them.
As well as that, come on! You must mean to create a new alert, as there is no option to clone in the alerts section.
It will need a bit of simplification lads, it would look like a little bit of feature creep has crept in.
The email is intended to inform the admin or the staff that the device is not operating within the thresholds that you have set. You can modify sending settings of the Alerts by going to: Configuration Templates -> Alerts -> Select the alert that you are using -> Additional Recipients -> configure who receives the notification and if they do.
The ticket is created once and then updates are added to it.
Yes, an Alert needs to be created but the sections are there and you can configure them differently or in the same way, depending on how you use it.
In regards to the simplification that you mentioned, we are always opened to feedback and quite looking forward to it.
Thank you.
To make it visually clear as well, here is the exact settings that you can control the emails. Please create a new alert with customization you require and set that one on your profile as alert type.
I understand now, so it’s a general email that lets you know that something has triggered only without specifics.
I’ve reverted to the RMM Console at present with the Portal monitoring disabled but I will bear this in mind for the switchover to ITSM. Many thanks for the explanation.