The “Custom script” which will be available in the “Monitoring” section help you to receive an alert for your own conditions.It helps you to create your own script procedure for monitoring, Alerts you if the condition has met and also generates the Tickets.
Note: We also have the other custom scripts from the below Webpage
Webpage https://forum.mspconsortium.com/foru…ors-index-page
Step[1]. Go to Configuration templates > profiles >Click “Profile” applied to a device that requires monitoring.
Step [2]. Choose ‘Monitoring’ from the ‘Add Profile Section’ drop-down. The ‘Monitoring’ screen will be displayed.
Step [3]. Enter details for “General” tab as below,
a)‘Monitoring Name’ - Enter the name for the monitoring configuration.
b)‘Description’ - Describe few words about your monitoring configuration.
c)‘Trigger alert any’ - Choose any one of drop down options mentioned below,
d) Any of the conditions are met '- Choose this option if you want an alert when any of the conditions satisfied.
e)All of the conditions are met '- Choose this option if you want an alert when all conditions satisfied.
f)‘Use alert settings’ - Select “Alert settings” from search box for this monitor.
Step [4]. Click ‘Add Condition’ . Select condition from drop down menu shown
- select “Custom Script” Condition To monitor
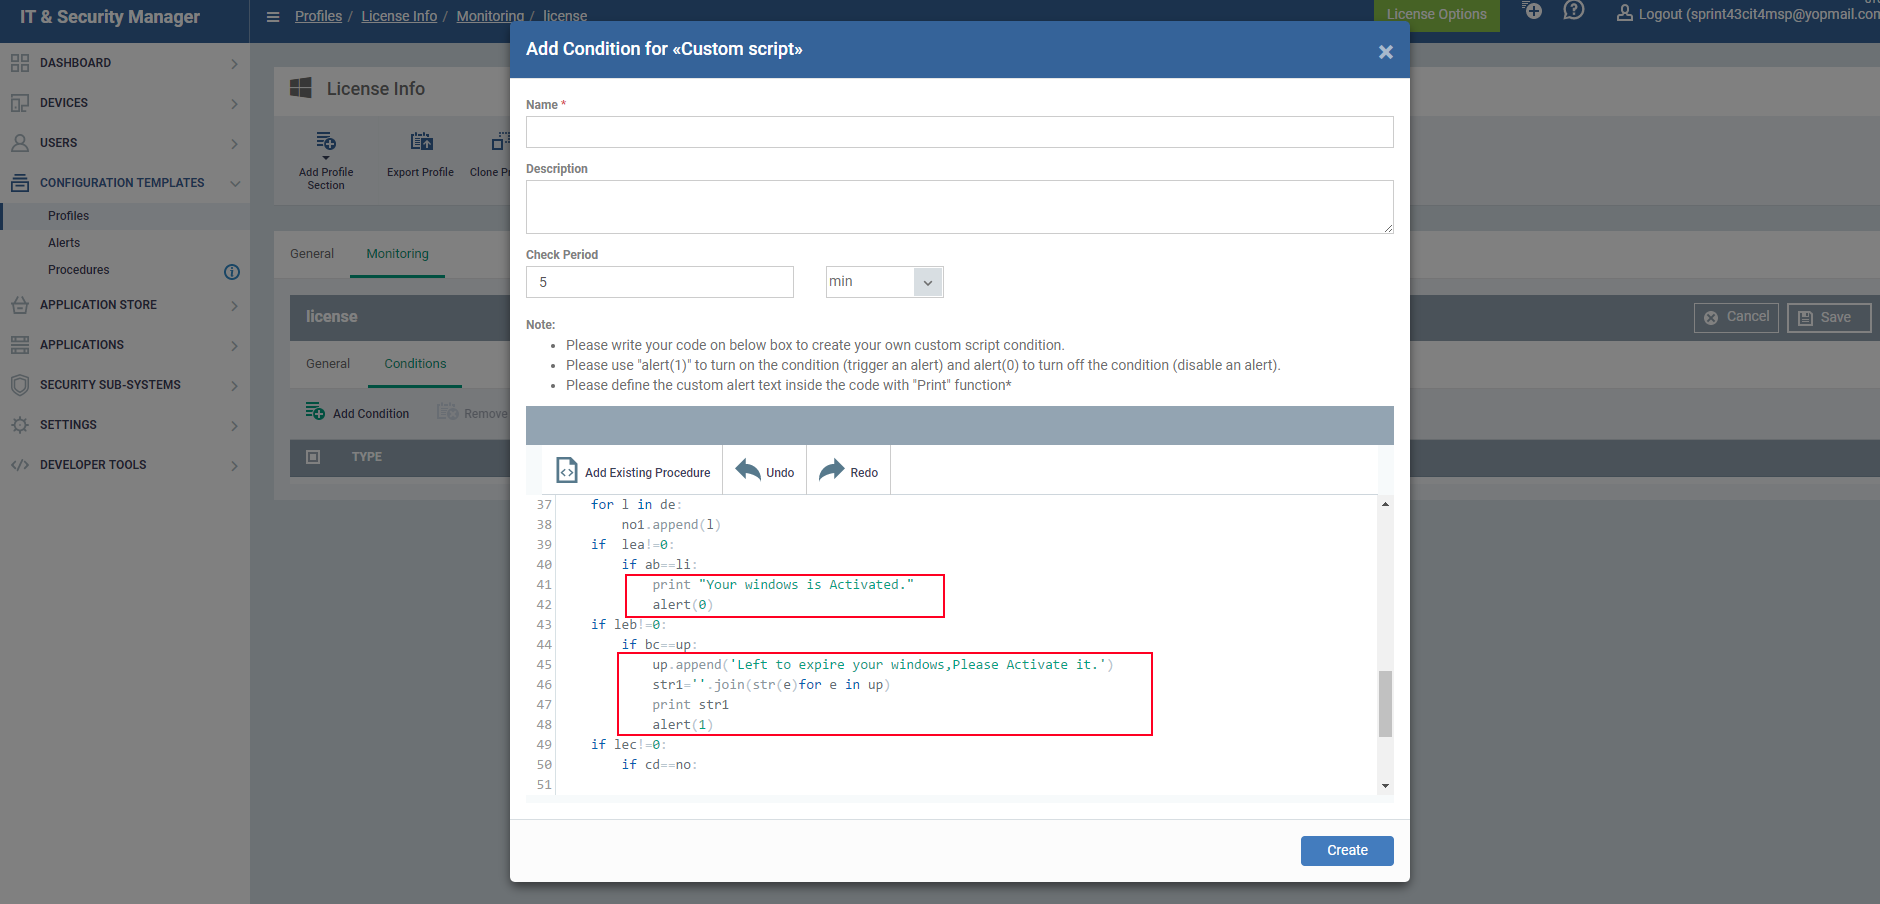
Step [5]. Fill Conditions for Custom Script
1)‘Script name’-Enter name of the script
2)‘Description’ - Describe few words about your monitoring.
3)‘Check Period’ - Specify the time period for which condition to be monitored.
4)‘Note’ - Please Read Instructions carefully.
a) Write your code on below box without disturbing alert function
b) To run a script as custom monitor, It has “alert” function definition as default. Check an example script.
c) To create an alert based on a condition call, call “alert” function with arguements “1” i.e( “alert(1)”) should be given to trigger the alert
d) To disable the alert based on condition call, Call “alert” function with arguements “0” i.e(“alert(0)”) should be given
e) please dont disturb the code below for default function definitions of an "alert()" and "check UAC"
The below code which should not be disturbed
import os
import sys
import _winreg

def alert(arg):
    sys.stderr.write("%d%d%d" % (arg, arg, arg))

# Please use "alert(1)" to turn on the monitor(trigger an alert)
# Please use "alert(0)" to turn off the monitor(disable an alert)
# Please do not change above block and write your script below
Here there is a sample Example to Generate the alert with Custom Script
Reference : Here you can refer a sample code
 <table>
<tr>
<td>import sys
import _winreg
import os
import re
import socket

def alert(arg):
    sys.stderr.write("%d%d%d" % (arg, arg, arg))
def information():
    name=os.environ['username']
    print 'PC-NAME : '+name
    s = socket.socket(socket.AF_INET, socket.SOCK_DGRAM)
    s.connect(("8.8.8.8", 80))

    print "IP-ADDRESS : " + (s.getsockname()[0])
    path="c:\windows\system32"
    os.chdir(path)
    out=os.popen("cscript slmgr.vbs -dli").read()
    c=0
    os.environ
    k,li,up,no,no1=[],[],[],[],[]

    ab=re.findall('Licensed',out)
    bc=re.findall('([0-9]{2}\sday.*)',out)
    cd=re.findall('0xC004F056',out)
    de=re.findall('0xC004F034',out)
    lea=len(ab)
    leb=len(bc)
    lec=len(cd)
    led=len(de)
    for i in ab:
        li.append(i)
    for j in bc:
        up.append(j)
    for k in cd:
        no.append(k)
    for l in de:
        no1.append(l)
    if  lea!=0:
        if ab==li:
            print "Your windows is Activated."
            alert(0)
    if leb!=0:
        if bc==up:
            up.append('Left to expire your windows,Please Activate it.')
            str1=''.join(str(e)for e in up)
            print str1
            alert(1)
    if lec!=0:
        if cd==no:
            print "You need to Activate your windows."
            alert(1)
    if led!=0:
        if de==no1:
            print "you need to Activate your windows."
            alert(1)

information()</td>
 		</tr>
</table>
Step [6].Click on "Save to apply your changes in the Custom script
Step[7]. Go to ITSM →Devices → Device List menu and click “Device Management” tab.Select a device to which you want to see the log files from the list.
Step[8]. Click on “Associated Profiles”
a) Profiles will be added here with Name,source Associated,Information about association.
b)If it is “successfully processed” ,go to next step to see the logs else, Check the profile if any Mistakes have done and correct it.
Step [9]. Click the “Logs” tab.Click “ Monitoring logs” tab, the triggered alerts will be listed here with the following details monitor name, Status , Hits Count(24H Period),last hit time ,Last Update time,and details
- Click on details
- You can see your custom script statuses with Additional information
- See below Figure with for Example
Very powerful.
Are log details only available in ITSM, or are these logs also sent through the syslog/logging mechanism from the endpoint?
Hello @Vincent_V,
Thank you for your feedback. The Logs details (Alert Logs, Monitoring Logs, Script Logs and Patch Logs) are only available in ITSM.
You can refer to this link for more information on Viewing Device Logs: https://help.comodo.com/topic-399-1-786-11343-Viewing-Device-Logs.html
We also have a script that you can run to get all ITSM (Monitoring, Procedure and Patch Management) logs as CSV file report. Also you have an option to print logs in ITSM portal.
Please refer to this link: https://forum.mspconsortium.com/forum/script-library/9144-get-itsm-monitoring-procedure-and-patch-management-logs-report
Hi @mkannan
I want to setup a monitor like this for RAM, CPU, Disk, & Network usage; however in addition to the default “Trigger if >70%” I would like to show top 5 processes using the resource. For the sake of the question, lets say I already have the scripts ready for each of these usage monitors.
Question 1: Can I add them all to the one monitor under ‘conditions’ and simply select “Trigger an alert if any of the conditions are met”?
Question 2: If I wanted to deploy this monitor for many devices (Across multiple company profiles) what is the best way to do it? Do I need to add this monitor to each existing companies profile? Or can I add the monitor to a “Resource Monitoring” profile, then add that profile to any device that required monitoring, alongside it’s existing company profile?
Does C1 support having multiple profiles linked to a single device? If they do, which profile takes precedence when there are settings that are clashing? e.g. Anti-virus OFF on one profile, and ON for another.
Hello @campbell,
It seems that the above post is related to your forum post ( https://c1forum.comodo.com/forum/products/other-comodo-products/comodo-device-management/15399-disk-network-monitoring#post15399 ). We will link both forum post to the ticket created and will keep you posted once the procedure is ready. Thank you