[I]Type of ticket creator: MONITORING
Event Created at: Sat Dec 03 03:46:33 UTC 2016
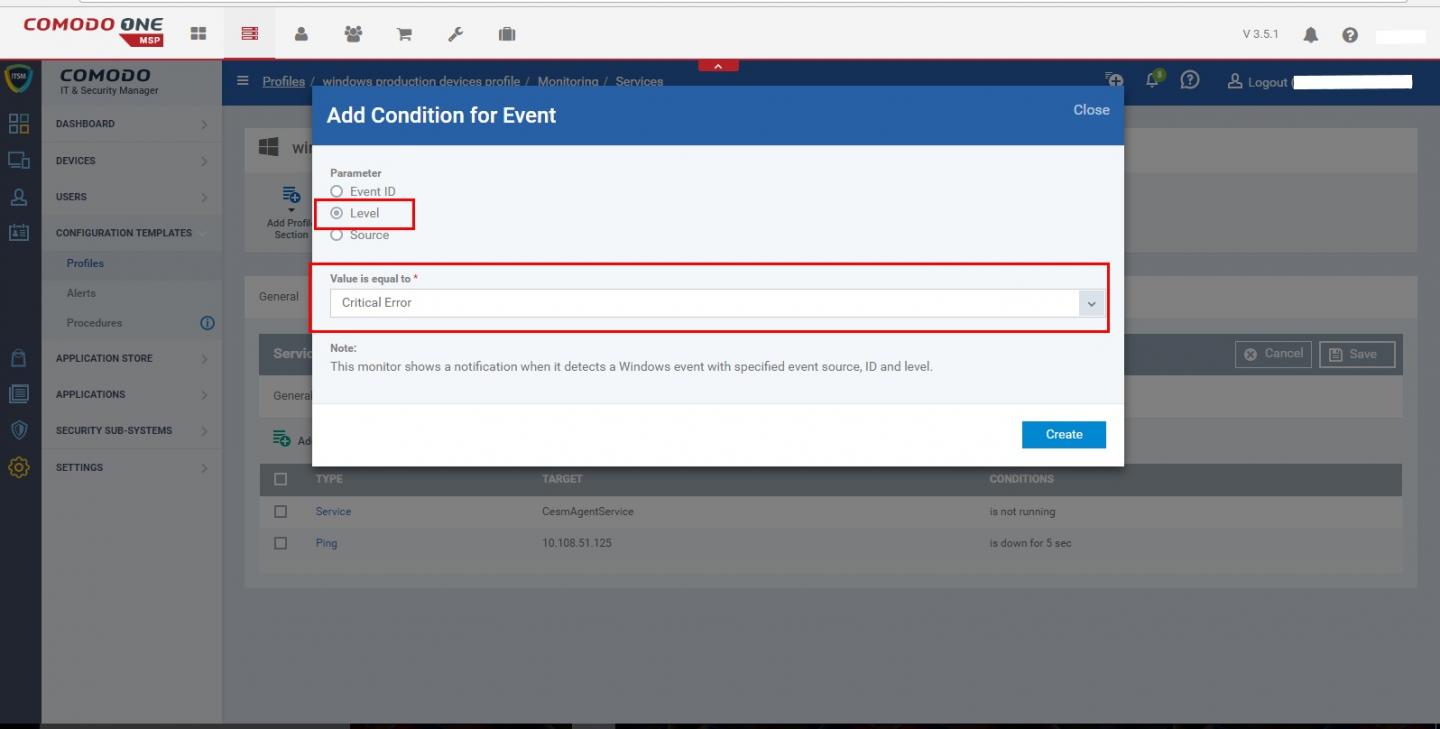
Data: Event Log Monitor : Condition: Event Level = Critical Error is occurred - Event is occurred.
Device Information: subDomain=pcdoctor-msp.cmdm.comodo.com
brand=To Be Filled By O.E.M.
model=To Be Filled By O.E.M.
domainWorkgroup=WORKGROUP
serialNumber=To Be Filled By O.E.M.
deviceName=TAXI02
companyName=Default Company
operatingSystem=Майкрософт Windows 10 Домашняя (x86)
owner=Default Company[/I]
I can’t understand wich exactly error occurs. It will be more clear if:
You mean be better remove monitoring of Windows journal and I should schedule 5* procedures for endpoints? Good idea, thank you
But what if no new alerts? And C1 can’t analyse procedures logs (reports) automatically.
You mean be better remove monitoring of Windows journal and I should schedule 5* procedures for endpoints? Good idea, thank you
But what if no new alerts? And C1 can’t analyse procedures logs (reports) automatically.
I am suggesting you to use “Event monitor” to generate alerts for windows events :). In order to get additional information on that alert please use " Run below procedure" option.
You can select only one procedure to auto remediation upon alert.
Now you see "Ticket generated in SD " as well as " Procedure logs in Devices " for the same alert.
Your request to provide more data on SD alert ticket is already taken.