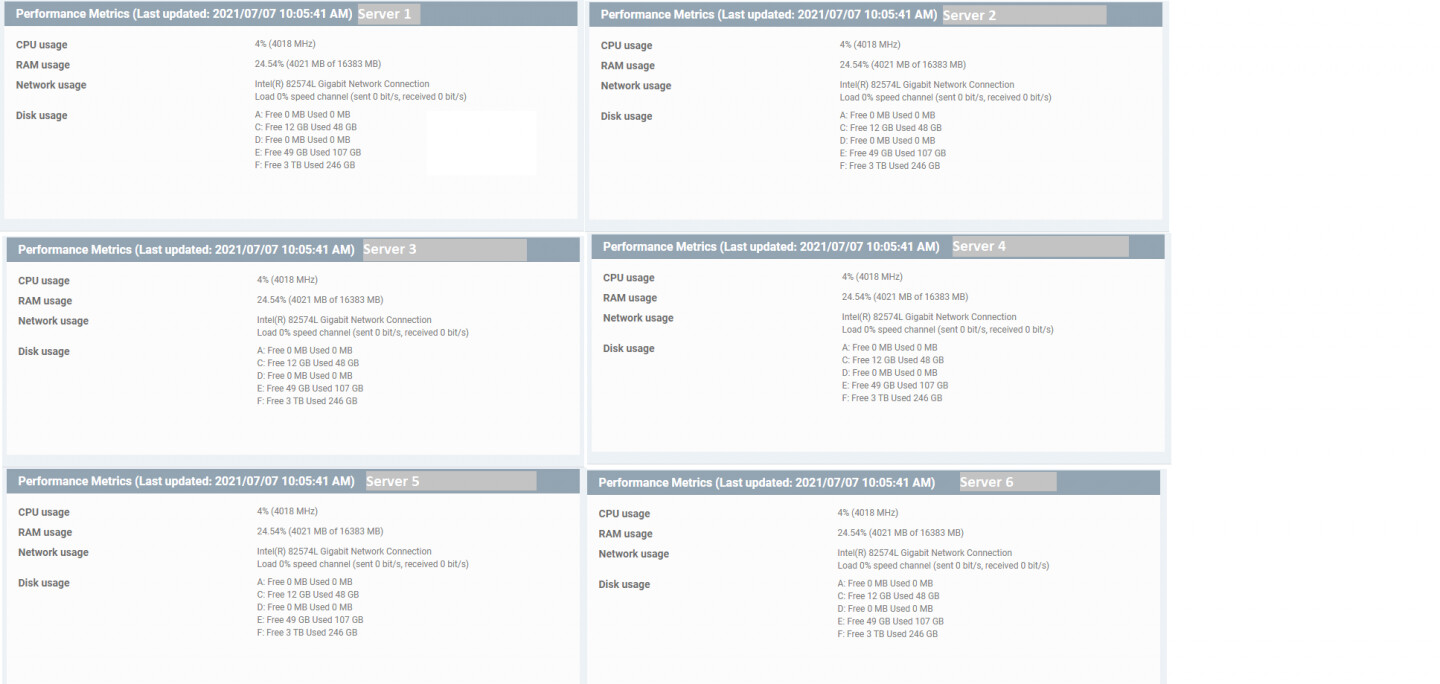
Hey I’m sure it’s here somewhere but i just don’t see it. Is there a way to pull all the itarian Performance Metrics all to one page for a group?
We are looking for a good way to see the CPU, Memory and Storage usage for our servers. I just took over managing the Infrastructure here and come from working all day everyday in n-able so i’m sure i just don’t know where to look for it here.
Think I requested something like this a while back, I know that a new dashboard or dashboards were being worked on a while back but we haven’t gotten any update on the status in quite some time.
they enabled a report that I can generate daily and get a pdf of these metrics. it’s better than nothing but we’d really like something that we can toss up on a large monitor and just see live stats. being able to see there is a problem before a user tells you a problem is HUGE!
I agree - Itarian needs a lot more additions and improvements to their dashboard.
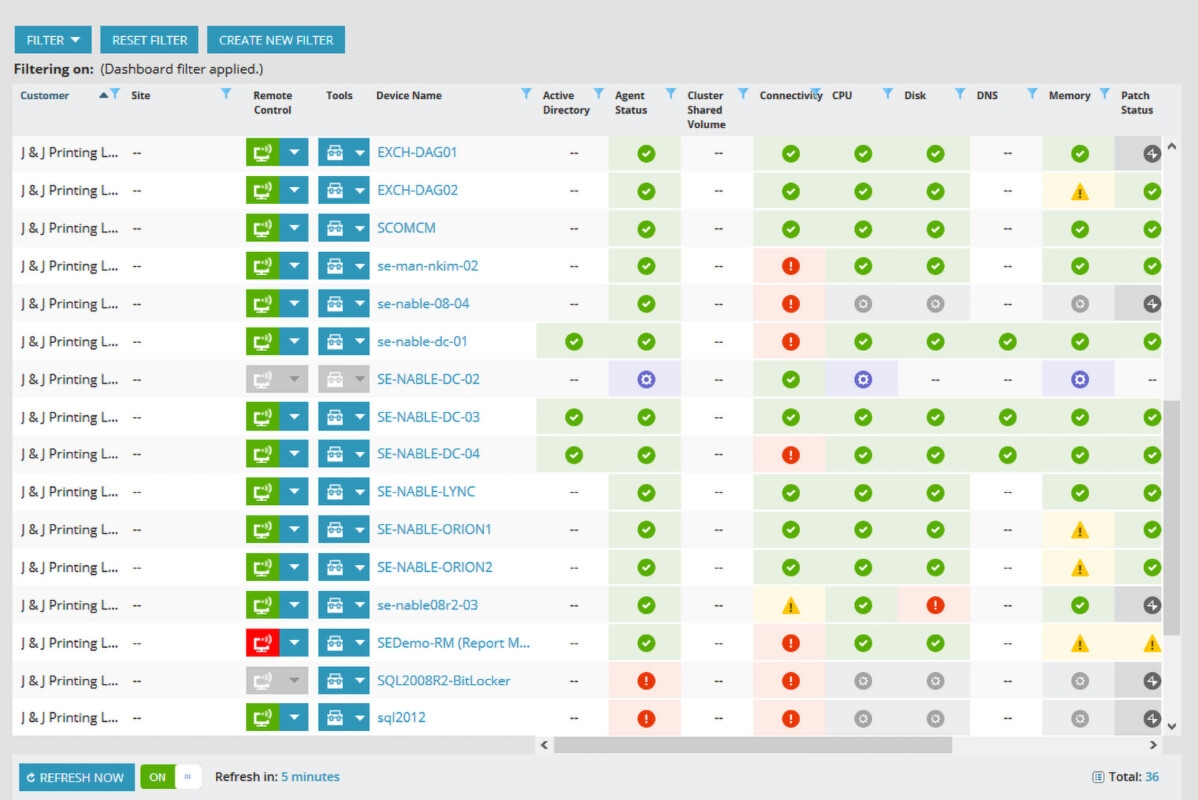
Being able to create a custom ‘view’ of agents that meet a certain criteria would be nice.
Also being able to add graphs or tables to the dashboard to show you, for example, how many devices that have a specific monitor triggered, such as like low disk space or high CPU usage would be nice.
I know we get alerts via email or on the dashboard - but having an up-to-date view on the dashboard of what devices need attention makes the job of the MSP a lot easier.