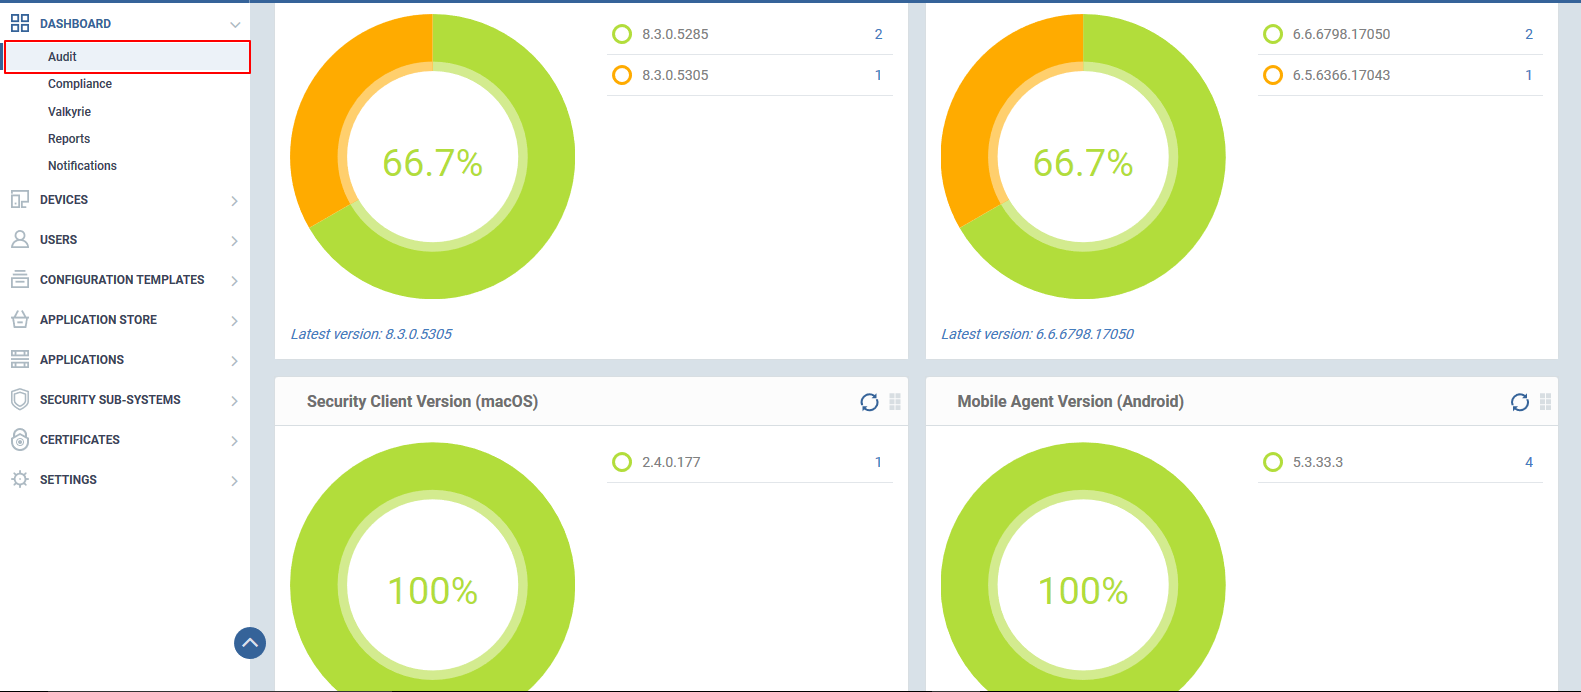
Step [1]: Go to Applications → IT and Security Manager→ Dashboard → Audit. In Audit page, chart diagram illustration will be available for the following data set categories
1.Security Client version (Windows) - The Security Client version (Windows) is the Comodo client security (antivirus software)installed in the endpoint.
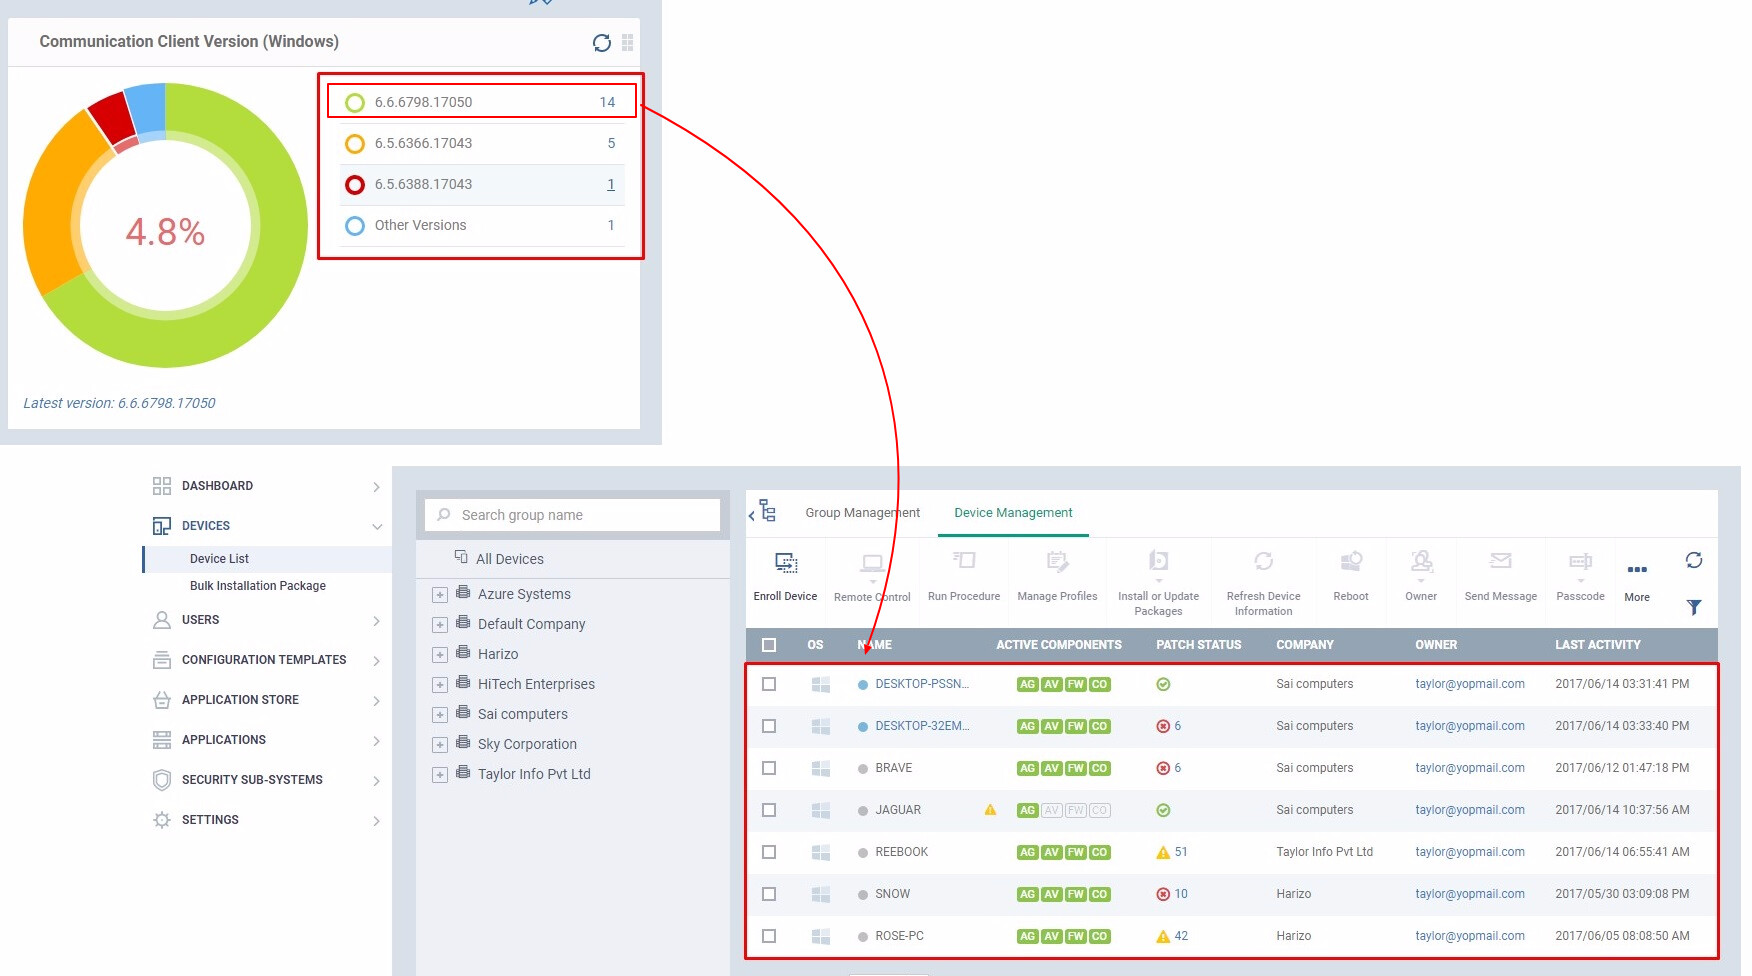
2.Comodo client communication(Windows) - Comodo client communication(Windows) is the Windows ITSM agent used to enroll the endpoints to the ITSM and apply its configuration.
3.Security client version (Mac os)- It is the Comodo client security (antivirus software )installed in the endpoint.
4.Mobile Agent version (Android)- This mobile agent helps you to enroll an Android device to the ITSM.
Step [2]: The widget, helps the user to identify and track the version that is being used/installed in the endpoints. In addition to that, the user can view the list of devices enrolled under each version.
There are three sub-sections available
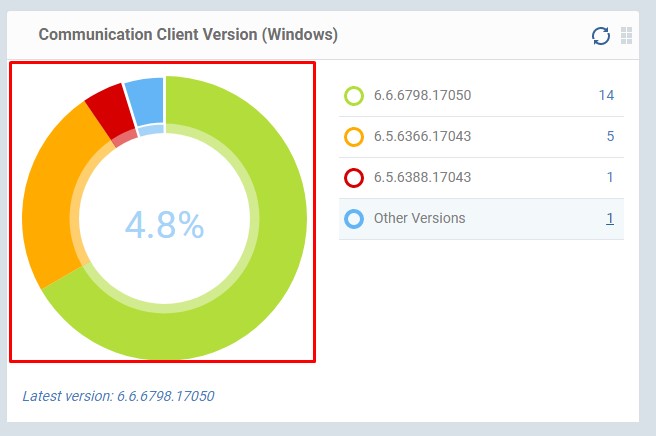
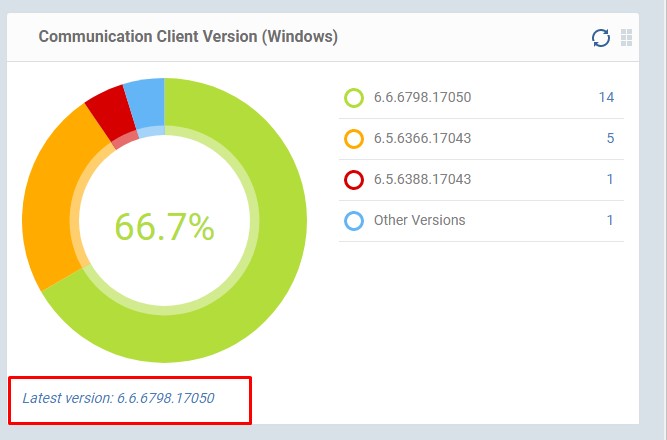
1.Ring Chart - The ring chart illustrates the data in percentage. The data are represented in different colors and if we hover the mouse over any colored area in the ring then, the percentage of that data will be displayed.
2. List of version - At the top rightmost corner, the agent’s versions which is currently available in the endpoints will be listed.They are listed in the descending order.
If you click the number adjacent to version, the machines which are using that appropriate agent (version) will be displayed.
3.Latest version - It is the latest version of the agent available in the one.comodo.com
For Example:
Ring Chart
List of ITSM communication client version:
Latest version:
CUSTOMIZE THE WIDGETS:
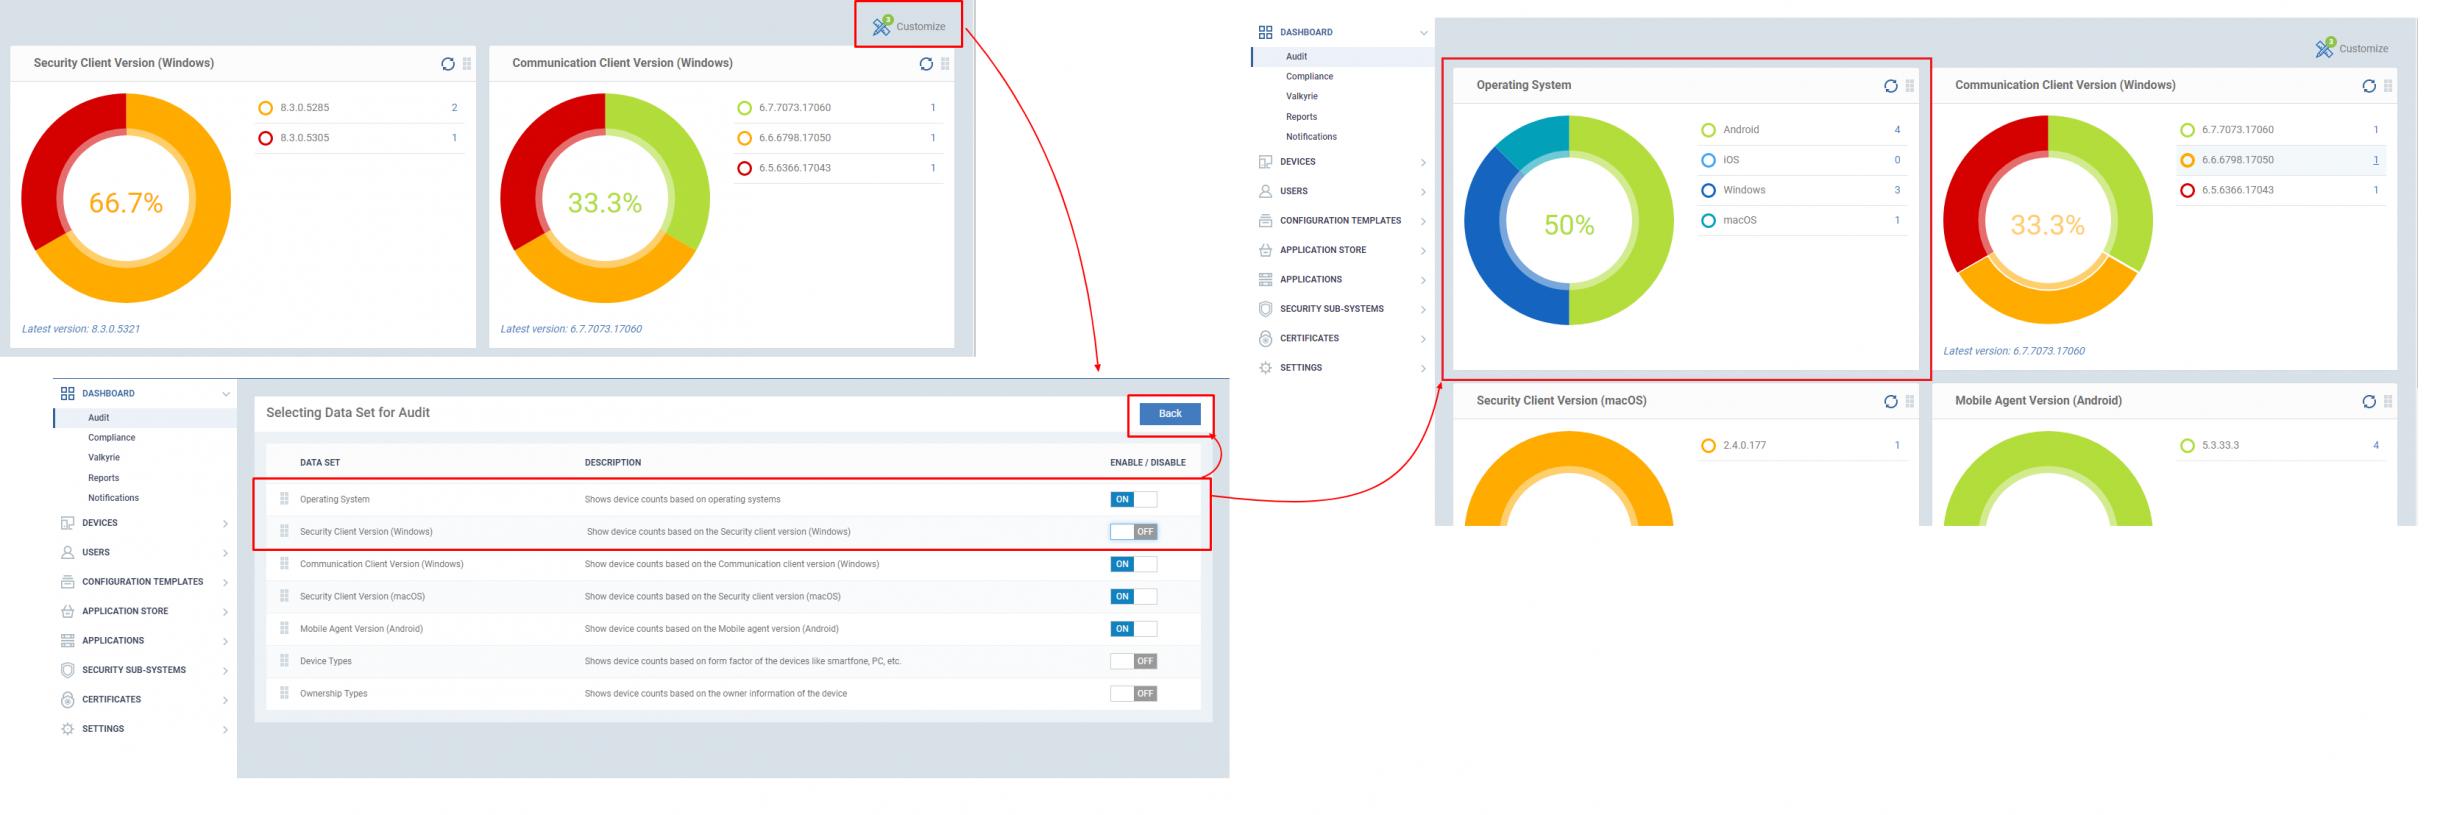
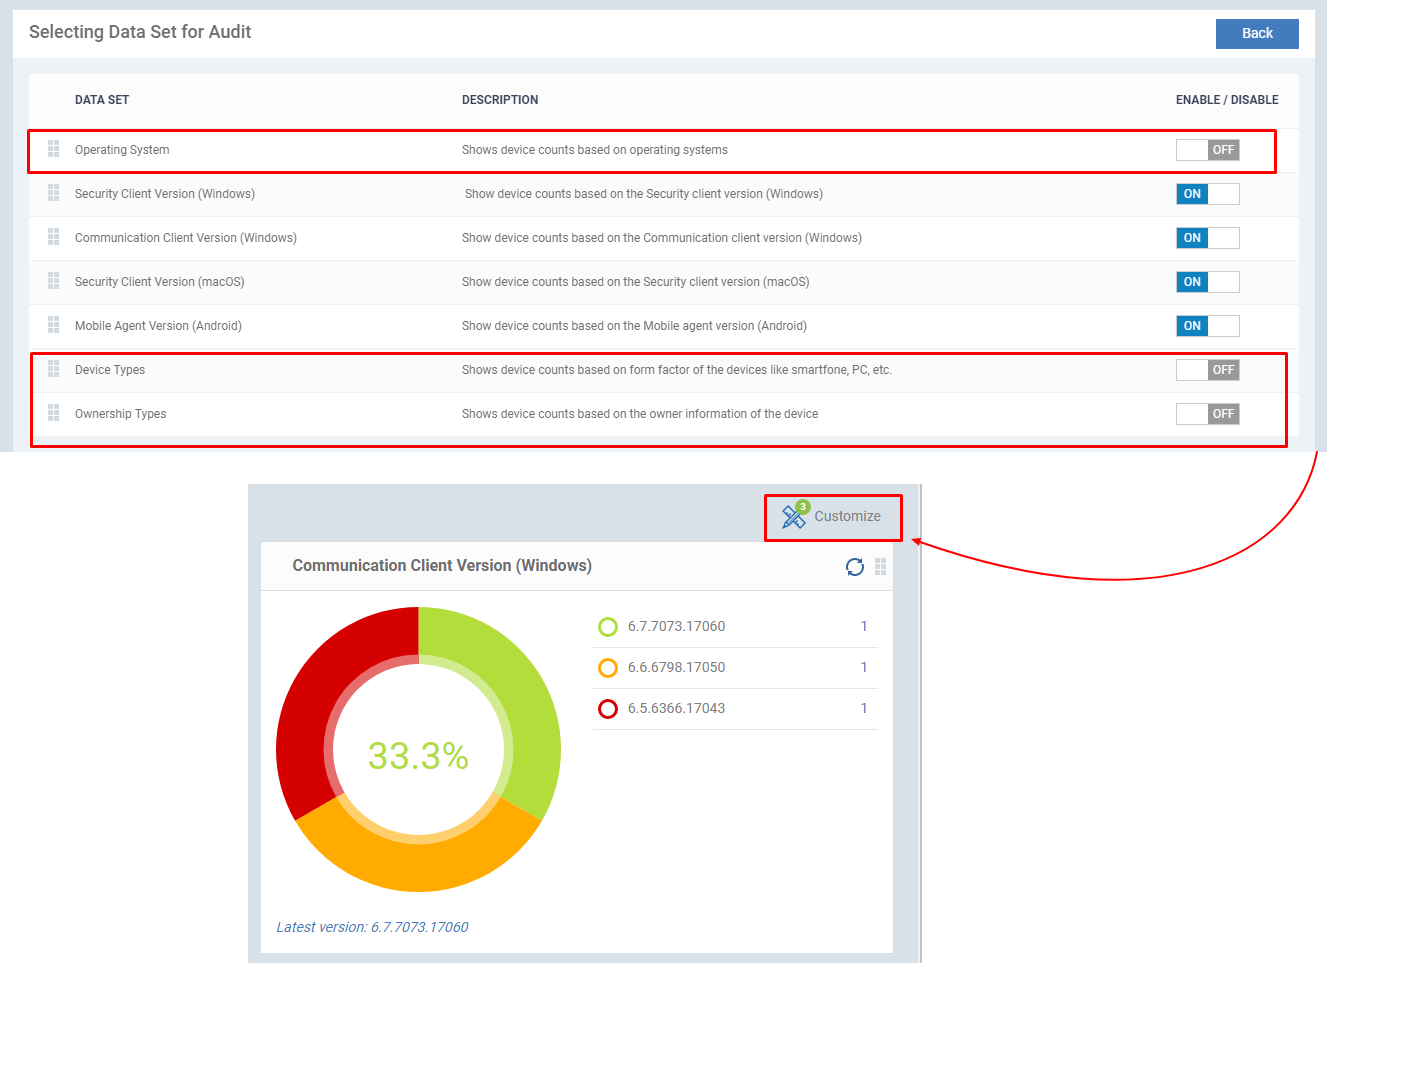
Step [3]: The widgets like operating system, Device types, Ownership Types are also available. The visibility of their data set in the audit page can be customized using customize icon.
To add or remove the widgets from audit page, click Customize button the “Selecting Data Set for Audit” will be loaded.Enable and disable the data set based on your choice and click back, the modifications will be applied.
Enable: Hover the mouse over the OFF section to enable the widget.
Disable: Hover the mouse over the ON section to disable the widget.
Example: The data set Operating System is enabled and Security Client Version (Windows ) is disabled.
Step [4]: The number of widgets disabled will be displayed on the"customize" icon.
Example: The three data set has been disabled, therefore the number 3 will be displayed in the customize icon.
Note: Data can be refreshed using the refresh button and the position of the widget can be changed using this icon.
Unless you implement the option to filter by organisations, all these dashboards will be rendered useless for client reporting and only ever be used for internal reporting. Considering this software is designed for MSP’s, I think you’ve completely missed the mark.
9 times out of 10 (mathematically speaking if we have 9 clients) we will be using this data to give meaningful information to Management (CTO’s, COO’s, etc. of clients) and very rarely are we required to use it ourselves to gain a holistic view of every client at once.
Will you consider implementing a feature whereby each of those sections can be filtered by organisation? Having the ability to export them as pdf’s (as is) would also work wonders. The current 1990’s theme of most exported reports isn’t exactly eye candy for customers to look at. Having something like this that looks great whilst also including meaningful, concise data is something our customers would look forward to receiving every month (which I can assure you isn’t the case now).
Hello @campbell,
This is a very great idea as well as informative information on how you or others may use this to even attract more clients. We will make sure that this is noted and look by our developers. Thank you and we greatly appreciate the inputs you have provided.
Hi Samuel C,
Are there plans on adding this to the road map anytime soon? Being able to filter these dashboards by organisations is the most important feature for us. It may take a while before you implement the feature to export the dashboard with the same visual format, though for the time being, if the data can at least be filterable by organisation; we can screenshot the dashboard and include them in client specific reports.
Hello @campbell,
As I checked the status of the request, it is being worked out, test and making sure that the functionality will work with other improvements on the dashboard. I also requested for an update so that I can provide additional information via the associated ticket address to your email address. Thank you