In Itarian RMM you are able to create a monitor and monitor events from Windows Event Logs.
However there doesn’t seem to be any documentation on what WEL’s get monitored. Is it just monitoring Application, System, and Security?
I would like to monitor some events that are in “Microsoft-Windows-Windows Defender/Operational” log.
When I add the ID and Source to the monitor, and trigger the event on a device, I do not get an alert, and the monitor is not triggered.
Hello @minntech !
Can you please give the details of how you configure monitor so that we try to reproduce?
- Create New Monitor
- Conditions:
- Event, Event ID - 1116, Level - Warning, Source - Windows Defender
- Event, Event ID - 1117, Level - Information, Source - Windows Defender
- Save Monitor
- Assign to Profile
- Verify Windows Defender is enabled
- Download EICARS sample
- https://www.eicar.org/download-anti-malware-testfile/
- Defender detects and removes sample
- Verify it logs 1116 and 1117 in Microsoft-Windows-Windows Defender/Operational event log
- Check Itarian and Monitor, no trigger and no alert
@minntech
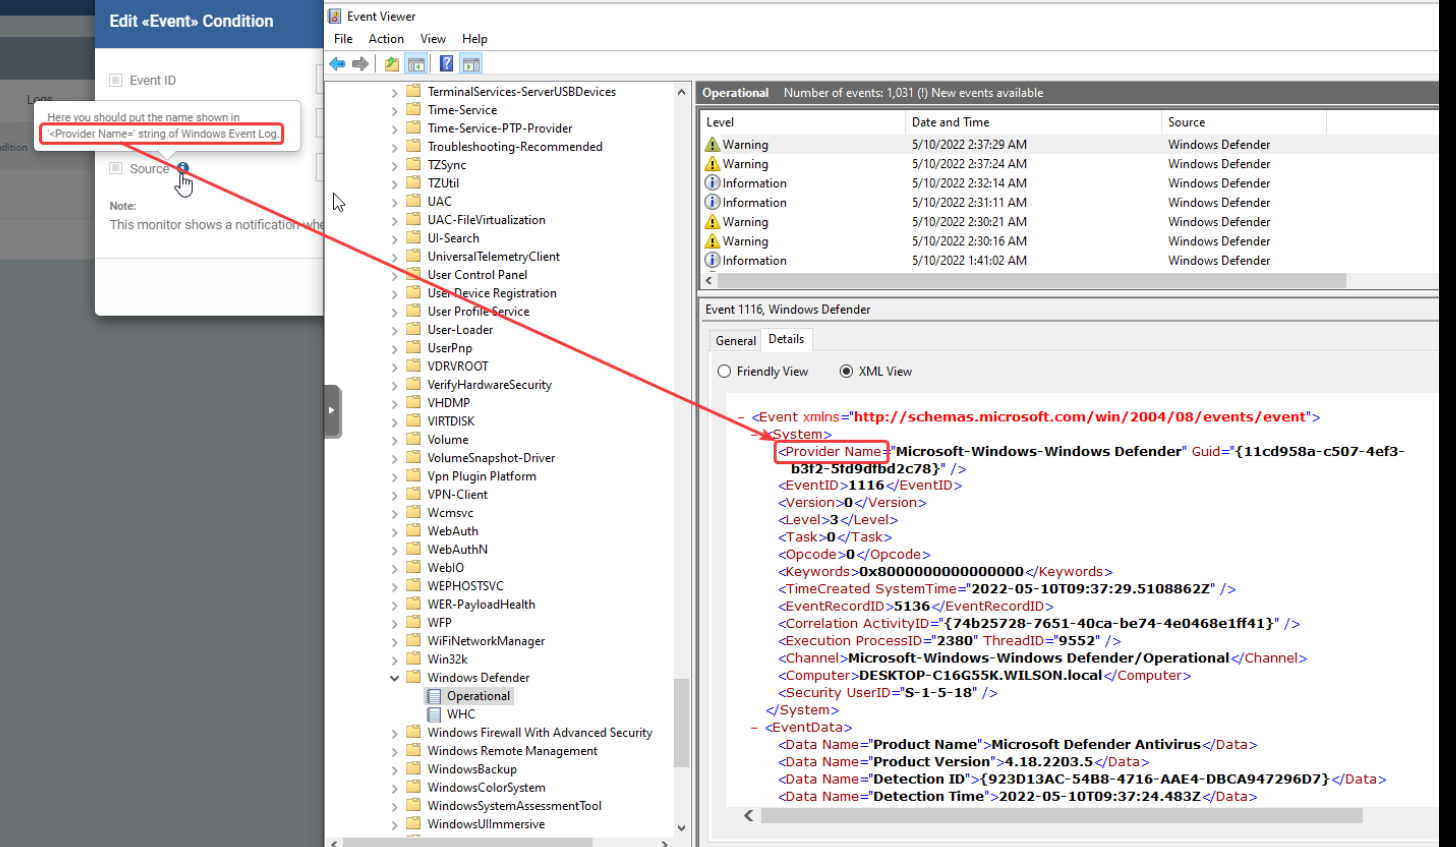
You did everything correct but the Source is what you configured wrong.
It should be Source Microsoft-Windows-Windows Defender but not Windows Defender.
Thank you for that clarification - I was under the impression Source meant the Source column in that screenshot.
Is it possible to include in the alert message, the text of the event that was logged?
For example this is what my alert reads:
Data: Event Log Monitor : Condition: Event ID = 1116. Event Level = warning. Event Source = Microsoft-Windows-Windows Defender. Channel is: Microsoft-Windows-Windows Defender/Operational - Event is occured
(I think occurred is spelt wrong in the alert)
It would be nice to have it also include the text of the event in the alert so in the future, when I dont recall specifically what event ID 1116 is, I dont need to go look it up. For example:
[I]Data: Event Log Monitor : Condition: Event ID = 1116. Event Level = warning. Event Source = Microsoft-Windows-Windows Defender. Channel is: Microsoft-Windows-Windows Defender/Operational - Event is occured
Microsoft Defender Antivirus has detected malware or other potentially unwanted software.
For more information please see the following:
https://go.microsoft.com/fwlink/?linkid=37020&name=VirusOS/EICAR_Test_File&threatid=2147519003&enterprise=0
Name: VirusOS/EICAR_Test_File
etc…
etc…[/I]
in addition to my last post, can I make a feature suggestion for Event ID monitoring?
Can the ability to add a text filter to the Event ID monitoring be implemented?
Example, some event IDs from the same source can be related to multiple different things. Take DISK, Event ID 7 for example.
https://www.wintips.org/fix-event-7-disk-has-a-bad-block-at-device-harddisk/
The “HardDisk#” and the “DR#” can be different depending on what disk the event is logged for. But I only really care about monitoring for \Device\HardDisk0\DR0, which is typically the boot drive.
If a text filter option could be added to the Event monitor in Endpoint Manager where I can specify something like HardDisk0\DR0 so that it only monitors for the Event ID 7 that contains that text, that would prevent me from getting lots of unwanted alerts. You can typically see this alert a lot when people use bad USB drives on a daily basis which I don’t care to monitor.
Also can we also have an option to only trigger if Endpoint Manager sees the specific event, a certain number of times over a certain period of time?
So for example maybe not a big deal to see a single Event ID type, but lets say I want a monitor to trigger if it sees 10 critical events in a 30 minute time-frame. Or the a single event ID might not be a concern but if there is 3 occurrences of the same event ID over a certain time period, I want the monitor to trigger.
Here is an example of how Datto RMM is setup:
https://help.datto.com/s/article/KB360021847131
Hello @minntech !
Thank you very much for the idea and how it’s implemented on Datto.
I took that in the roadmap but I am not currently sure about technical implementation of that.
Will make the research before giving any information.
Kind regards.
The time-weighted alerting might be a stretch, I jsut see its possible with the built in performance metrcis in Endpoint Manager so figured worht a shot to request to other things like event log monitr.
However I would like to see a even description filter be implemented if at all possible since most other RMM platforms have this feature which add further level of filtering specific alerts within the same ID and source to capture.