Hello,
Which features do you need so that you can move to Itarian?
Please list everything that you need so that you can move to Itarian.
Thanks in advance,
Hello,
Which features do you need so that you can move to Itarian?
Please list everything that you need so that you can move to Itarian.
Thanks in advance,
Full SNMP functionality including for HP servers is desperately needed.
OS Hardening with different security level Profiles for desktops, laptops and servers.
“Which features do you need so that you can move to Itarian?”
It would be good to ask your current users what we want to NOT moving out from Itarian:
So basic all the basic functions… No need for new functions if these still aren’t working after all these years.
Just my thoughts…
The question definitely should be “What features do you need that would stop you moving to another platform?”
I agree with @ailan , the forum is full of requests and unresolved requests or “it’s on the roadmap”
Proper 3rd party installers, not just updating
Ability to single click alerts to be taken to useful information
Remote from mobile device
Scripts ability to add from portal not download & import
Web filtering from portal
Larger file transfers, copy and paste in remote that works
The list is long and very slow to implement, roadmaps mean nothing most of the time.
I personally use several RMM products and none are perfect or do everything the way we want
I’ve stuck with Itarian with the hope it evolves a little more as I’ve managed to find most work arounds as needed.
EG Scripting mostly via the PowerShell method appears most stable for me.
So, step up and get the platform running with existing requests first, then ask for what we would like.
I may add, a few other RMM’s are very proactive and transparent, eg when patching is an issue, they acknowledge and advise what they are doing short term and long term to fix.
They also have feature requests, enough users ask they do actually try to implement.
Regards
mcfproservices
Something very simple as sort the columns by clicking the top - i.e. when looking at installed patches bring all the “No’s” to the top - some pages get sorts and others don’t - come on guys I asked for this maybe 5 or 6 years ago …
We are actively looking at alternatives as we have never put our full estate on - just too many “little” issues that never get sorted.
To top it all this morning the service is really slow - unworkable - greyed out screens (A report has been running for 20 minutes - normally takes seconds…)
Agree with both ailan and mcfproservices sort the existing first and then add the extras like nct and libretech have suggested.
I believe that to fulfill the request mentioned already and those that will come after my post requires a new platform I believe that the current platform has been outgrown years ago and Comodo/Itarian should develop a new management console platform that is more flexible and scalable. Or purchase the technology.
since you asked…
Better Reporting
Executive Reporting for QBR that have important key metrics are desperately needed here. Either great static reports or the ability to add custom elements to the report. It should include…
Better Dashboards
The Itarian Portal dashboard graphs and data always lags behind what is actually reporting in Endpoint Manager. Dashboards are useless if they dont show you up-to-date information. The Itiarian dashboard will show my endpoints being online when they are offline or vice-versa because it doesnt seem to be polling Endpoint Manager frequently enough. No matter where I go to look, if its Itarian dashboard or EM dashboard that reports the same data, I should be seeing the same data, not different data.
Need better dashboard for viewing monitors. I should be able to add a widget to Itarian Dashboard or have a central place where I can see at a glance, which Monitors are triggered ON and for which device that is instead of having to drill down into device logs. This would allow to address urgent monitors more adequately in case an email or portal alert are missed. With that said, clearing alerts in the Itarian dashboard alert should also clear them from EM alerts and vice versa - currently you have to go to 2 different places to clear these alerts.
Better Device List in Endpoint Manager
Ability to list. filter, and sort devices based on any of the criteria that Endpoint Manager logs for the devices. Such as manufacturer, IP address, formfactor, last reboot, just to name a few.
Actually Work on New Features
Over the years it seems like new features get tossed into ITarian and labeled as Beta and they dont work 100% or at all, and it takes a very long time for progress to be made or none at all.
Fix the bugs in Endpoint Manager
Over the last couple months of getting things updated in Endpoint Manager, I seemed to have uncovered bugs in the profile system. Cloning profiles doesn’t appear to be reliable. If you clone a profile then remove certain sections from the profile, it still deploys those settings to devices. After working with support they say this should be fixed in future updates… well lets get working on resolving known issues.
Another one, just today I realized that none of the previously created Custom Script Monitors which had been previously working for months, are no longer running or logging data anymore. I had only found this out because I created a new custom script monitor today and assigned it to a profile, only to see that it was not running or logging any data to my devices. When I went to check my other custom monitors, I found that none of them have been logging any data for months.
I have a ticket open with support to figure out why this is happening. Hopefully not related to the cloning of profiles I did a few months back, but who knows at this point. I’m sure they can get it figured out but it seems like stuff randomly stops working with no clear explanation.
More Endpoint Manager features for other Operating Systems
Other than installing EM on Linux and seeing basic system info, you cant access a remote shell or do anything of use other than just seeing that there is a device there. Lets get some basic functions for other operating systems. The ability to remote SSH or run a shell right from the device portal would be nice.
Better Profile Management & Deployment
I have requested this before on this forum, but the way Endpoint Manager deploys device profiles needs to be more flexible. It should be a tree hierarchy with Global as the root node, and the customers as individual nodes. We should be able to apply device profiles similar to something like Windows Group Policy where they are layered and can be filtered. We should also be able to filter device profiles to apply only to devices that match specific system data.
For example I would like to create a device profile that has specific settings for Dell systems and I would like to be able to filter that to only devices that have “Dell” listed as manufacturer. This way device profile with specific monitoring or procedures can be created for different hardware or applications like SQL, Active Directory, and applied specifically to machines with those roles installed. This eliminates the need to create many different groups or manually applying profiles to devices.
Get rid of old modules/applications or the ability to disable them - Whats the future here?
A handful of the modules I have in the Itarian Portal I dont use or they dont load.
I get it that Itarian needs to catch up to the bigger RMM providers, but it seems like only a few core modules are actually developed by Comodo/Itarian and the rest are pulled from opensource applications like vtiger and OSTicket. When they announced a new service desk I was interested but after they enabled it, it seems to be another opensource project - faveo-helpdesk. Is this kind of thing sustainable from a development standpoint? Wouldnt it make sense to develop a unified platform internally instead of trying to piece together many different third-party projects?
Im not trying to be overly critical here, there are a lot of things I do like about Itarian, mainly the RMM and security features and the ability to incorporate other Comodo products into the stack, because that’s what I need, but the rest of it seems like it lacks direction.
Thank you for such a wide feedback.
All the items will be analyzed and put in the development roadmap. We will be informing on what will be delivered when.
I would like to take you at your word, but that sounds like the same reply that is always given on these forums.
Here is my request that I made almost 2 years ago regarding the profile system:
https://forum.itarian.com/forum/prod…files-policies
Scroll down and you see someone stating that it will be on the roadmap. It’s been almost 2 years and I haven’t seen or heard anything on the matter. If you want to poll your customers and take their feedback seriously, implement some system for that, like canny.io where customers can submit feature requests and vote on them.
The lack of some of these features doesn’t keep me from using your product on the scale that I do - but that’s because my business is currently smaller and so far its meeting those needs. But if you really your want customers to be deploying this software to thousands of endpoints, spanning dozens of clients, you need to have features that scale. If I had 100+ customers, and if each had to have their own device profile, and every time I wanted to make a global change I had to update 100+ different profiles, that would be insane. That is just one example.
While I dont claim to be an expert, I do speak from experience. The past 15 years I have worked for other companies as a Sr level technician and in some cases advisor to other MSP businesses and have used many of the major RMM platforms like Kaseya VSA, Datto RMM, and ConnectWise. None are perfect, but most of them have 1 thing in common and that is routine development. I have since started out on my own and currently ITarian meets my needs, but that remains to be seen as I plan to grow my business. I need products that make my job easier not harder.
Yes, @minntech
You are totally right. These kind of replies is something that is given always and before I have something to push to production from the list - I can not say that this time it’s different.
What I can say, though, is that it’s really analyzed and taken into account.
We may raise a system for collecting the requests later but at the moment I want to put out the fire on the items that are most painful and easy to be fixed quickly.
After quick fix items - we’ll get to bigger items.
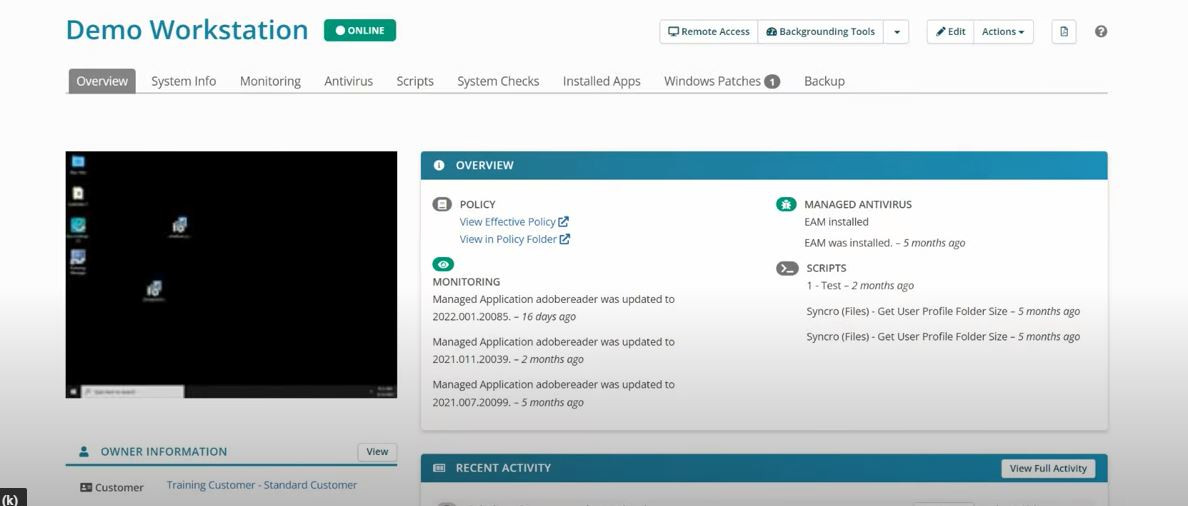
A current screenshot of the desktop in the device summary screen as others do such as Kaseya and Syncro. It’s a great asset if you need to do maintenance/remote work knowing the device isnt being used.
@Ed_Johnson
Thank you for the input.
Is top left screen is realtime device screen view or a recent screenshot?
The screenshot is from the latest device information refresh. You have the option to refresh device info which pulls in the latest screenshot. Not perfect but is adequate if used along with comparing cpu/hdd activity.
Thank you for the details!
I would love the ability to create procedure lists.
Say for example- we have several procedures used to speed up the first-time setup of a domain device.
Instead of running each procedure individually, it would be awesome to be able to execute through a list- in the case a “first-time-setup procedures” list.
On a side note, the procedures are one of the features that really set this endpoint protection apart from the competition. Excellent work ITarian I’ve been very impressed so far!
Schedule reboot/shutdown - The ability to schedule reboots or shutdown of devices from the portal.
Thank you, @Ichomancer , @libretech .
I added your requests to the roadmap list.
Awesome, Cheerds Vadym
The thumbnail image does update periodically when you leave KLC open, might be something like every couple minutes. Just to get an idea if a user is on it and working.
Kaseya Live Connect Features:
https://help.kaseya.com/webhelp/EN/VSA/9050000/#33845.htm
Its an add-on application that needs to be installed on the device you access VSA from in order to launch it. Id much rather see as many features packed into web vs requiring additional software to use them since every time they do a VSA update they require you do download and install new KLC.
They also utilize different agent status icons:
https://help.kaseya.com/webhelp/EN/VSA/9050000/#5528.htm
This is how their agent device view works. Its not the cleanest thing to look at but the best part of it, is you can add pretty much any data point to the list to filter and sort from:
https://help.kaseya.com/webhelp/EN/VSA/9050000/#41766.htm
You can then extend filtering by creating what are called “Views”, that essentially let you pick what types of agents to display based on lots of different criteria
https://help.kaseya.com/webhelp/EN/VSA/9050000/#214.htm